Loader is a free and cloud-based load testing tool that allows you to stress test your web apps and apis with thousands of concurrent connections. If you want to buy a high-performace web server, it is the right tool for you to take a testing before you buy.
It's very easy to use, but before testing, you have to sign up an account and verify your domain by uploading a file to your website root directory or modify DNS records. In case someone may use this tool illegally for DDos attack.
How to Use
I am walking you through briefly, If you want to take more advanced features, please take a look at its documents.
Test Settings
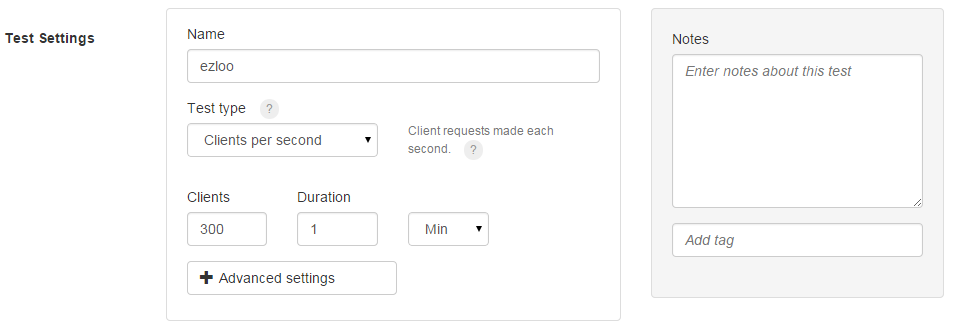
Here is a screenshot of starting a test, there are three test types for choose.

Clients per test: Whatever number you enter here is the number of connections that will be made to your server over the duration of the test.
Clients per second: Whatever number you enter here is the number of connections that will be made to your server per second.
Maintain client load: There is a "from" and a "to" field. The test starts with some number of connections ("from") and can increase the connections throughout the test, reaching the number in the "to" field by the end of the test.
If you want to customize the error threshold, timeout values, or add basic authentication to your test, click the "Advanced settings" button to expand these options.
Client Requests

For the most basic level, all you need to do with the URL field is enter the URL you want to test. The default is to do a simple HTTP GET request to that URL. Click on the respective button to add headers, GET/POST parameters, a payload file, raw body, or response variables.
Schedlue Test

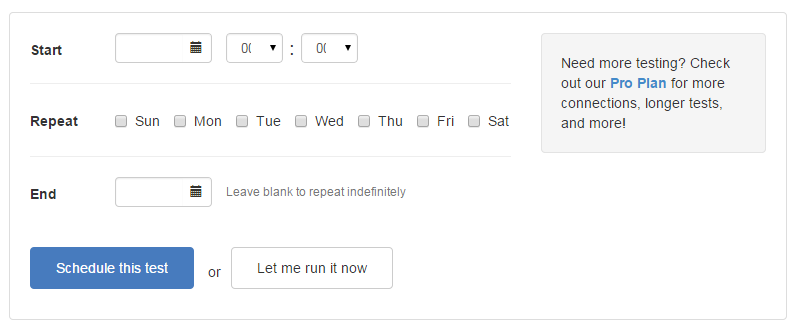
If you want to test your website repeatly, you can set a date and time to run the test, and select the days you want to repeat it on. The date and time should be in your local timezone, you can set it in "settings", the test will run at the time you set in your local time.
Test Results
After the test has done, a results page will shown to you, let's break down the results page into three sections.
Summary Data

This section shows you the Response Times, Response Counts, Bandwidth and Redirects of the test.
Graphs

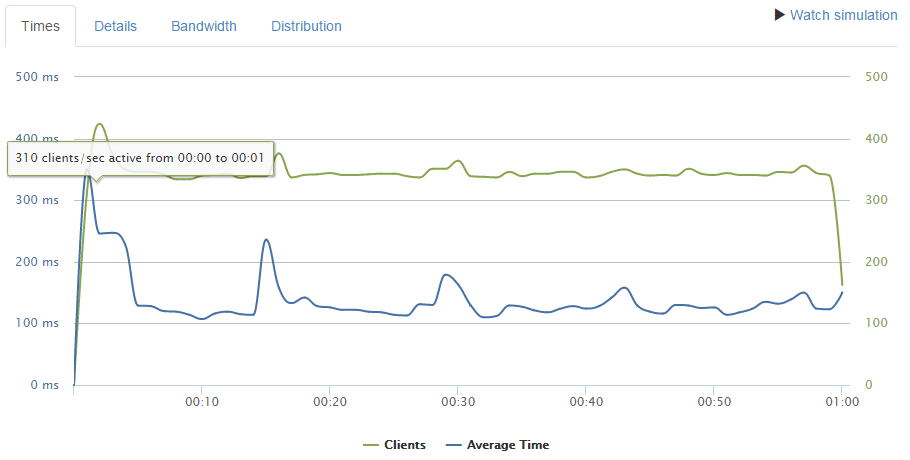
There are three graphs (four for pro users!) that give more detailed information about what is going on during the test.
- Times shows the average response times and the number of active clients.
- Details shows details about requests made, responses, and errors.
- Bandwidth shows how much bandwidth was used.
- Distribution (Pro only) shows histograms of responses times and bandwidth.
Trends

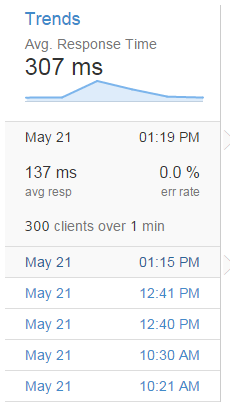
The average response time shown under "trends" is the average response time over all test runs. Click on the trends to see more detail and a summary of each run.
Summary
Online stress test tools are much easier than command line tools like Apache Bench, what you need is to fill the blanks, and the results are shown to you with clear details.
Currently all tests are run from Amazon’s US-east datacenter. Multi-location testing is currently in private beta, if you want to test web hosts out of US, it may not that precise because of long distance and international network situations.


